The tool is based edge recognition, in particular
on the recognition of straight lines
and the analysis of their inclination. This second version represents a further step toward a more
advanced tool based on proper "shape detection".
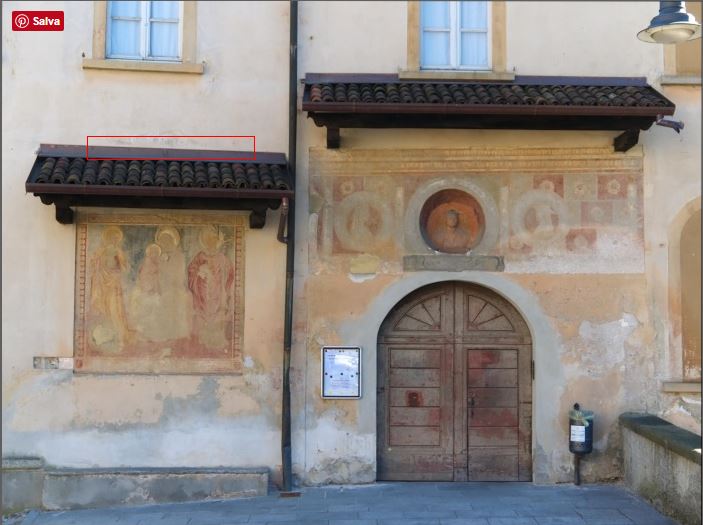
To get an estimation of the rotation needed to align the pictures you want to use to get
the HDR image, you must first of all choose the area where to search for the straight line
to be used as a reference. You define it through the same rectangle with red border
that you can use to analyze in an automatic way the
shift. Just click once on the less exposed image to open the rectangle, and then doubleclick
to close it.
Consider that you should, of course, choose a rectangle that is oriented in the same way like the
edge you want to use: vertical rectangle for ca. vertical edges and horizontal
rectangles for ca. horizontal edges.
Now it is no more necessary that the chosen area contains only one single well defined border,
because the algorythm is now able to handle the presence of more the one border. Nevertheless you should
avoid "too complicated situation" with several borders distributed on a range of angles, since
this could still cause errors!
Furthermore this new version of the algorythm is much faster than the previous one!
The algorithm is based on edge detection, i.e. on the identification of the points where
the gradient is greater, the creation of the regression line corresponding to it
and use its slope as a reference to compare the pictures.
The ability to handle multiple borders and angles was obtained adding the following steps:
- All the gradient vectors of the selected points are added to a datatable
- The rekords in the datatable are ordered according to the angle and an histogram is created
in order to select the most represented angles.
- The points corresponding to the most represented angles are sorted according to the their coordinate
on the axe which is nearer to be orthogonal to the regression line which describe them (after having subtected the slope
corresponding to the found angle) so to find the most represented coordinates. This passage is for separating the
parallele borders.
-
Determing for each subgroup of points the regression lines which describes them best.
-
Determing the slope of the homologous regression lines in each of the two or three pictures,
after having eliminated the ones not present in all pictures.
-
Calculation of the rotation which best describes the angle differences between the various lines
present in the pictures.
A gradient vector is generally composed of two different components: one related to the
brightness (i.e. to the module of the vector that describes the color present in the pixel)
and one relative to the orientation (i.e. the unit vector of the vector that describes the color
present in the pixel). For example, in the case of the transition from a light gray to a
black area, the first component is great, while the second one is null. On the contrary,
when passing from a pure blue zone (#0000FF) to a pure green one (#00FF00) the first component
is zero, while the latter is maximum.
Four modes of calculation of the total gradient are provided:
- Weighed: Total gradient is calculated by weighing more the predominant component,
in order to highlight differences
- Predominant: At every point only the predominant component is considered
- Color: Only the orientation variation component is considered
- Brightness: Only the module variation component is considered. It is the best choice in most cases.
The parameters on which one can act to optimize the process are two. The first one is the value of the fraction
of the largest total gradient vector found in the area analyzed necessary for the point to be
considered (Min module, i.e. the threshold varies automatically depending from the luminosity
of the images to be analyzed). The second is the value of the fraction
of the largest peak in the angle distribution necessary for an angle to to be considered.
To obtain correct angles is
necessary to choose suitably the parameters, in particular the minimum module and the gradient
type to use. If the minimum module is too small, then there will not be enough points to create the
regression line, if the minimum module is too large, then the edge will be masked by points not belonging to it.
Regarding the second parameter, if you choose a too high treshold, you will borders although they are
well defined. In the contrary a too low level will couse to consider relevant points which
in reality contain gradients only due to random variation in the lightness of the picture, i.e. you will
include noise in the calculation.
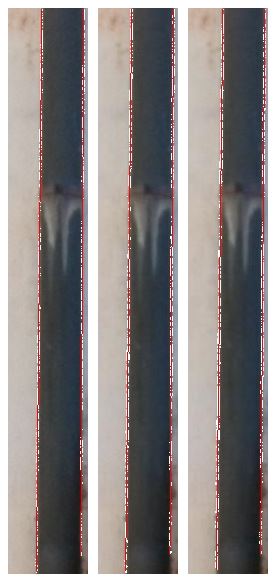
Consider by way of example the following three images, in fact always the same image rotated by
known angles (0.05° and 0.1°):
 Image rotated of 0.05°
|
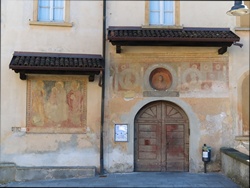 Image rotated of 0.1°
|
 Original image
|
In this example it is possible to analyse the area like the one in the following picture:
Using Min Module = 0.5, Angle peak treshold = 0.85 and Luminosity gradient, you otain what is shown next.
In the three pictures the colored pixels are the ones used in the first passage.
Yellow the ones where the orietation gradient is dominating, black the ones where the module
gradient prevails, green the centers of gravity of the distribution for each value of the
independent variable with respect to the construction of the regression line, and red the two
regression lines (in this case almost coincident):
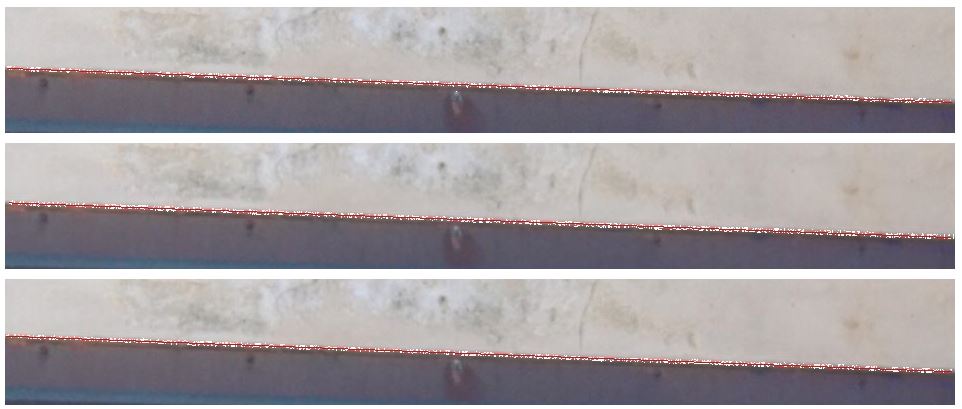
with the (correct) suggestion of rotating the first picture of -0.053° and the second of -0.099°.
Notice the case in which the chosen area contains two borders at the same time:

Using the same parameters you obtain the following:
with the suggestion to rotate the images of -0.055° and -0.102° respectively, a result, therefore,
just slightly less correct than in the previous case!
The images above can be downloaded in original size in order to use them for experimenting!
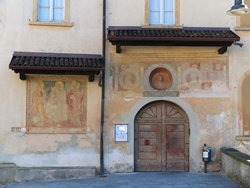
Obviously the tool is suitable in particular for architectural pictures, whereas it is almost
useless in case of landscape pictures, for which a pixel per pixel optimiation would be necessary.